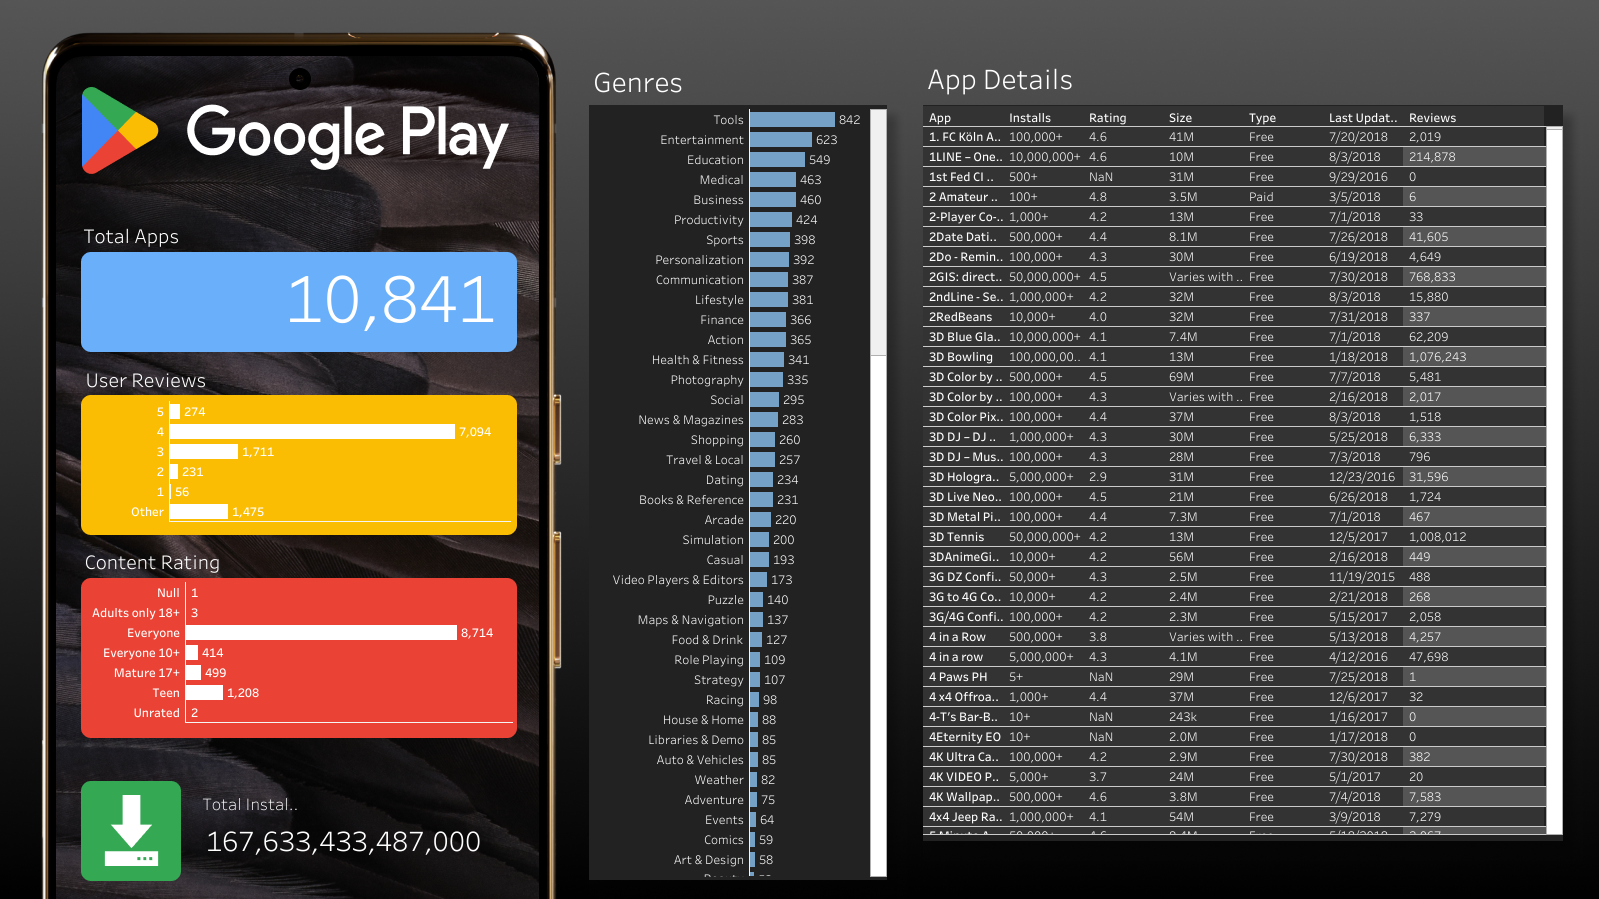
Problem Statement: The challenge was to present a dashboard that allowed quick identification of the number of apps, user reviews, content ratings, and total installs, all while supporting the brand identity of the Google Store and the Google Pixel 8.
Methodology:
- Data Analysis: Using AI to analyze public-facing data.
- Prototype Design: Building the design in Figma, using the phone as a focal point, and adopting Google’s color story and block design approach.
- Unique Identifier Challenge: Treating the app name field as unique based on the version release date to create a key value for the dashboard.
- Category Grouping: Defining groups for total apps, user reviews, content rating, and total downloads as the top KPIs. Using the Genres field for category navigation and creating an app detail crosstab for individual app information.
- Development: Utilizing Tableau Public’s web authoring tool to construct the dashboard as a portfolio piece.
- Quality Assurance: Ensuring data filtering and display accuracy by comparing with the original data set.
Risks and Solutions:
- Lack of a straightforward key value: Overcome by using the app name with version release dates.
- Granular user reviews: Resolved by writing custom calculations for the 1-5 rating scale and classifying outliers as ‘Other’.
Outcome: The project resulted in a user-friendly, interactive dashboard that effectively showcases the required metrics and aligns with Google’s brand aesthetic. It demonstrates that with focused effort on data analysis and design, a comprehensive and effective dashboard can be created in a relatively short timeframe, in this case, approximately 3 hours.