Case Study: Electric Vehicle Population Dashboard for Washington State
Client Objective:
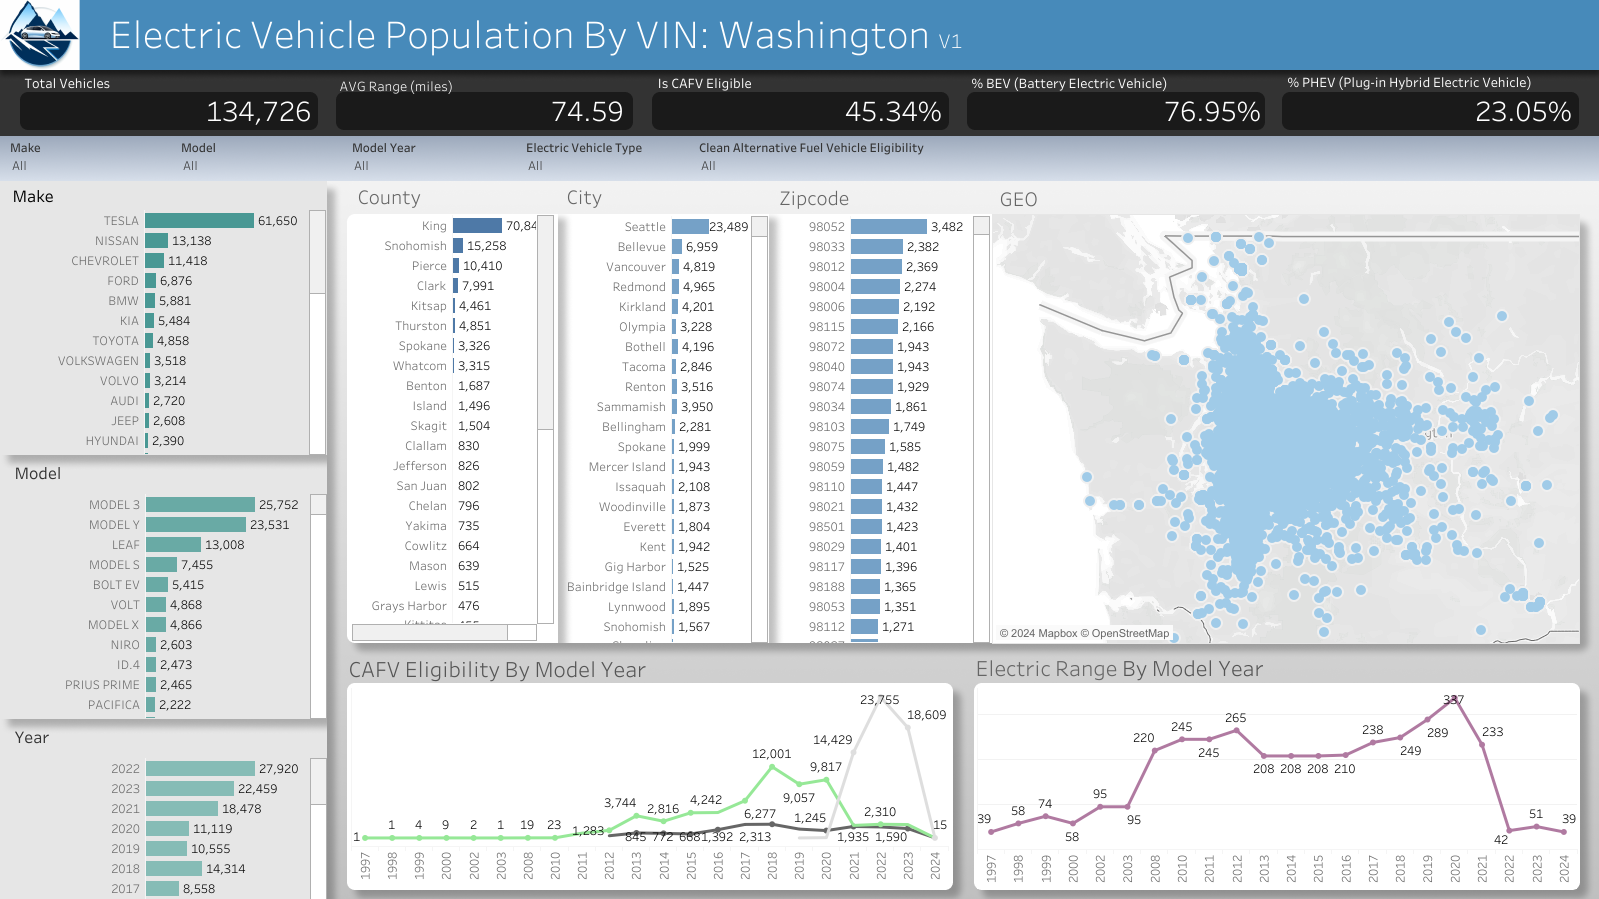
The client aimed to build a comprehensive dashboard to analyze the electric vehicle (EV) population in Washington State. The goal was to enable users to explore EV data through various dimensions, including make, model, and year, as well as geographical aspects such as county, city, and zip code. The dashboard was also designed to visually represent EV density on a map for intuitive understanding.
Key Features and Insights:
- Density Analysis: Geolocation data is prioritized to show vehicle density, with a map highlighting the distribution of EVs across the state.
- Performance Classification: The dashboard tracks the evolution of vehicle models from non-eligible to eligible for Clean Alternative Fuel Vehicle (CAFV) incentives, illustrating improvements in efficiency.
- Electric Range Display: It distinguishes the range capabilities of fully electric vehicles versus hybrid models, clarifying that pure electric vehicles like Teslas offer a longer range than hybrids such as the Toyota Prius.
- Percentage Metrics: A main KPI metric differentiates between Battery Electric Vehicles (BEV) and Plug-in Hybrid Electric Vehicles (PHEV), simplifying the distinction for users.
Challenges and Resolutions:
- Data Cleaning: The dataset included non-Washington vehicles and had incomplete fields. Incomplete model year data implied a decrease in electric range for recent years, which was counterintuitive given technological advancements. The dashboard design allowed users to interpret these anomalies.
- Incomplete Fields: Average vehicle costs were excluded due to insufficient data. The client initially hoped to correlate charging station locations with range and population data, but this was deferred for future expansion.
Design and Development:
- User-Friendly Layout: The dashboard emphasizes geolocation data, using filters for make, model, and year to facilitate easy navigation and understanding of volume counts.
- Streamlined Aesthetics: A clean color scheme was applied, limited to the default palette of Tableau Public’s web authoring tool due to constraints on using custom colors.
- Efficient Build Process: Custom calculations distinguished between BEV and PHEV vehicles, and the remaining data required minimal formatting.
Outcome and Future Considerations:
The client was pleased with the final dashboard, which provides a clear and concise interface for exploring EV details, CAFV eligibility, electric range, and geolocation. While expanding the dataset to include vehicle pricing and charging station locations would enhance the dashboard, these aspects were beyond the project’s current scope.
Project Duration: Approximately 4 hours, with the bulk of time dedicated to data verification and validation.
The case study outlines the successful creation of a functional and informative dashboard that met the client’s objectives despite data limitations, demonstrating the client’s commitment to a clean, straightforward design that enhances user experience. Future updates may further enrich the dashboard’s utility with additional datasets.