Streamlining BI with Analytics Design Systems: A Smart Approach to Saving Resources
Introduction to Analytics Design System
Imagine an innovative strategy that revolutionizes your analytics approach, boosting user engagement, minimizing rework, cutting development time, and uniting stakeholders towards a shared goal. This transformation, common in app and website development, is now achievable in business intelligence through the adoption of an Analytics Design System.
The Importance of UI and UX in Business Intelligence
Despite its critical importance, the business intelligence sector often overlooks UI and UX. Gartner’s report indicates that 80% of data initiatives fail due to unclear goals, with only 27% of users acting on the data they receive. An effective Analytics Design System addresses these challenges by focusing on user-friendly and impactful dashboard designs.
Overview of the Analytics Design System
Similar to design systems in software development, this system uses reusable components in tools like Figma, streamlining the creation of business intelligence dashboards. It aligns teams early in the process, enhances data storytelling, and fosters stakeholder engagement.
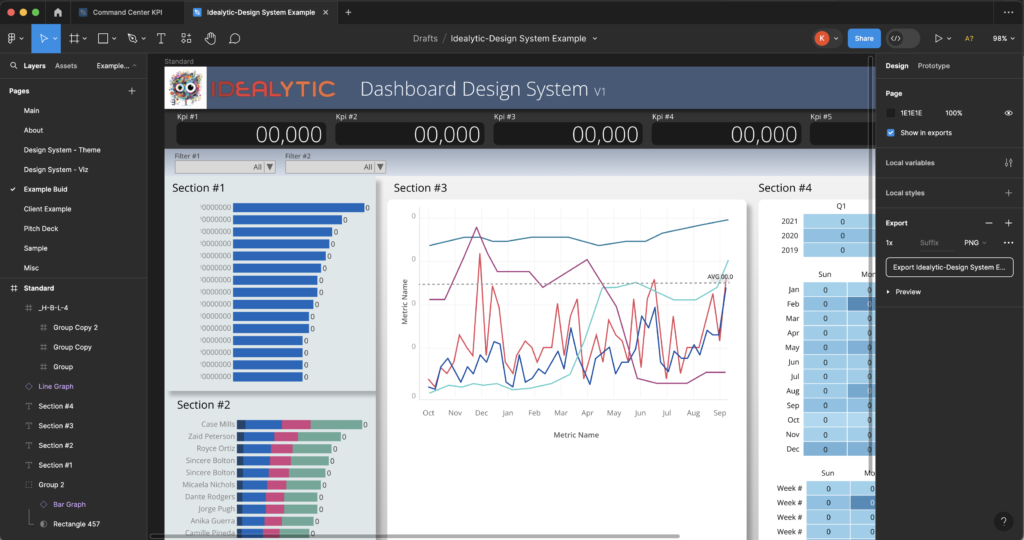
Custom-Built Analytics Design System in Figma
Focusing on the most adaptable elements, this system identifies common design patterns in dashboard creation. Inspired by principles from Brian Frost’s Atomic Design System, it features a two-part library for backgrounds/templates and graphs/charts/filters.
Key Benefits of the Analytics Design System
- Blueprint for the Team: The design serves as a comprehensive blueprint, showing the anticipated state and final delivery, guiding the entire team towards a unified vision.
- Data Mapping Assistance: It aids the data team in understanding the data and mapping it appropriately to the visual elements.
- Stakeholder Engagement: The system allows stakeholders to socialize the design within the organization, gather feedback, and make necessary adjustments.
- Reduction in Costly Reworks: By providing a clear vision from the start, the system minimizes the need for expensive reworks.
- Aligning Remote and Offshore Teams: The system ensures remote and offshore teams are aligned with the project’s design standards and goals.
- Standardization and Templates: It creates a set of design standards and templates for the project, ensuring consistency and quality.
- Reduced Documentation: The visual nature of the system reduces the need for extensive documentation, giving developers a clear visual to build against.
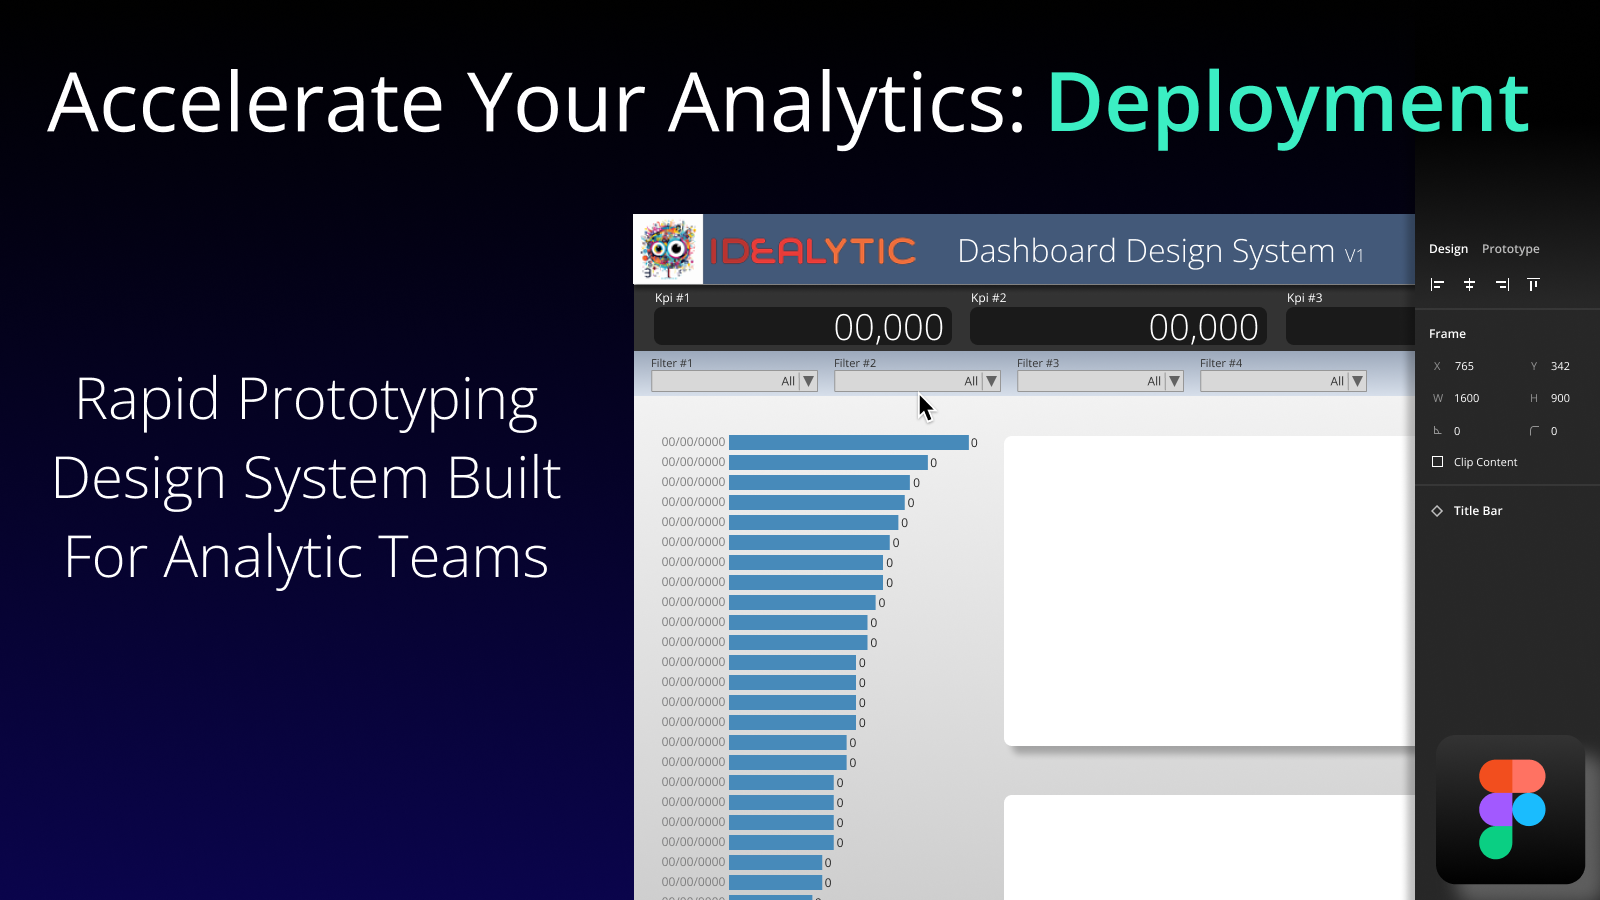
Rapid Prototyping and Collaboration
The system allows for rapid prototyping, starting with drag-and-drop simplicity and evolving into manual refinement. It uses zeroed-out data in templates for focused discussions on design and functionality, avoiding premature data accuracy debates.
Conclusion: Transforming Business Intelligence
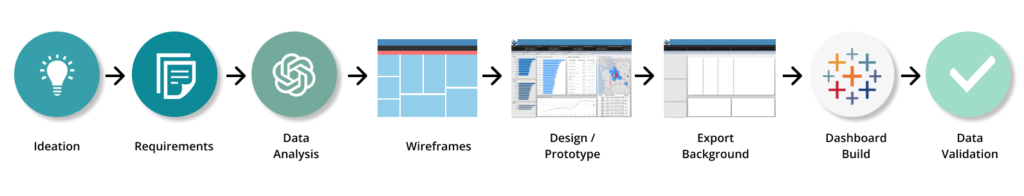
This Analytics Design System accelerates the dashboard prototyping process, promotes team cohesion, reduces unnecessary iterations, and delivers more accurate and impactful dashboards efficiently. It marks a significant advancement in business intelligence, focusing on creating meaningful, user-friendly, and effective data experiences.