Case Study: Tableau Dashboard
Executive Summary:
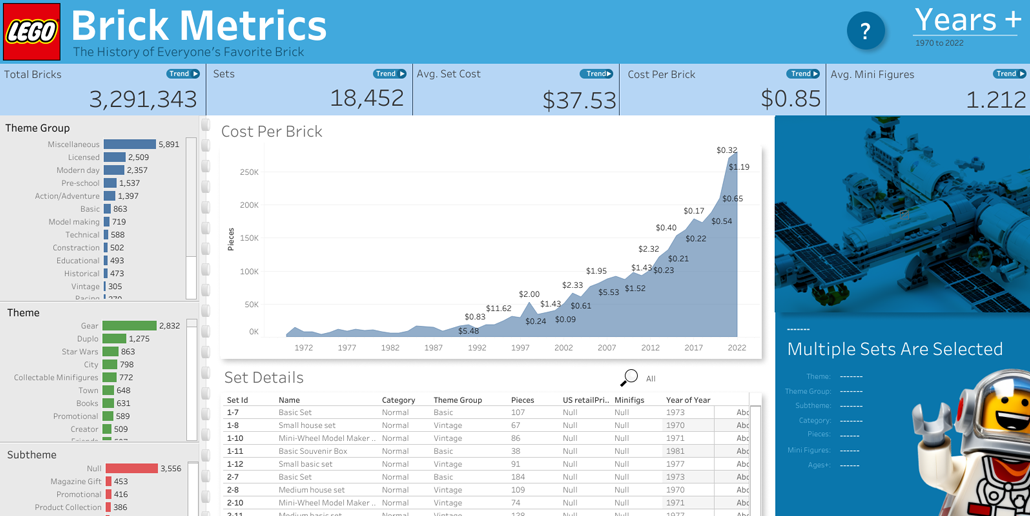
This case study describes the development of an interactive dashboard for the Maven LEGO Challenge, showcasing the evolution of LEGO sets from 1970 to 2022. Leveraging ChatGPT for data analysis and validation, and utilizing Figma for design, the project team overcame data limitations and technical challenges in Tableau to create a user-friendly and engaging experience, reflecting the playful spirit of LEGO.
Introduction:
The Maven LEGO Challenge sought to create an interactive tool allowing users to explore the rich history and evolution of LEGO sets. The project aimed to encapsulate LEGO’s brand essence while delivering an informative experience to users.
Problem Statement:
The challenge was to present trends in LEGO kits over 50 years in a way that was both informative and engaging. The dashboard needed to enable exploration of LEGO’s product evolution and invoke a sense of playfulness and nostalgia.
Case Description:
The data set included LEGO sets from 1970 to 2022 with details like theme, pieces, age recommendation, price, and image. However, early data was often incomplete or sporadic, and Tableau’s cloud server had a limitation of displaying only 100 images via URLs.
Methodology:
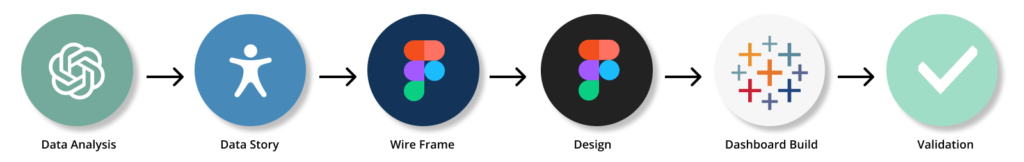
The project followed a standard process for building a Tableau dashboard:
- Data Analysis: Using ChatGPT, the team quickly and effectively analyzed the public-facing data, identifying limitations and gaps, especially in the earlier years of the dataset.
- Data Story and Wireframing: A wireframe was created to outline the data story. The team used Figma, adhering to their design system, to lay out the dashboard efficiently.
- Dashboard Development: The dashboard was built in Tableau Public’s cloud-based environment. The team focused on handling missing data and the image display limitation.
- Solution Engineering for Image Display: A creative solution was devised to overcome the challenge of displaying LEGO set images within Tableau’s limitations.
- Data Validation and Calculations: ChatGPT was also used for data validation and to assist in writing calculations for handling various data states, including nulls and unselected data filtering.
Findings and Analysis:
The analysis highlighted key trends and changes in LEGO products over the years. Despite data challenges, the team was able to extract meaningful insights.
Solutions and Recommendations:
- Address data incompleteness through thorough analysis and validation.
- Develop a user-friendly and visually appealing dashboard design.
- Engineer a solution to overcome Tableau’s image display limitation.
Implementation Strategy
- Utilize a step-by-step approach for design, development, and refinement.
- Leverage ChatGPT for efficient data analysis and validation.
- Apply creative problem-solving to technical challenges.
User Acceptance Testing:
The dashboard was tested for functionality, including theme filtering, year exploration, key metric visibility, and image display upon kit selection. The focus was on ensuring ease of use and brand alignment.
Risks:
- Constraints of Tableau Public Web Authoring Environment.
- Impact of incomplete data on user understanding and insights.
Conclusion:
The Maven LEGO Challenge resulted in a successful interactive dashboard, showcasing the evolution of LEGO sets over five decades. The project demonstrated the effective use of AI tools like ChatGPT and design software like Figma to overcome data and technical challenges. The final product not only met the project objectives but also brought joy and satisfaction to the team, serving as a showcase piece for potential clients and employers.
References and Appendices:
- Maven LEGO Challenge
- ChatGPT
- Figma + Custom BI design system
- Technical notes on Tableau limitations and solutions.
Through this case study, the Maven LEGO Challenge exemplifies how combining AI tools, design thinking, and technical expertise can result in a compelling and interactive data visualization project. The project showcases how to turn data challenges into opportunities for creative problem-solving, ultimately delivering a product that resonates with users and aligns with the brand’s identity.